Six Ways to Lower Rising Health Costs for Companies
Read more
Research report, Fall 2026
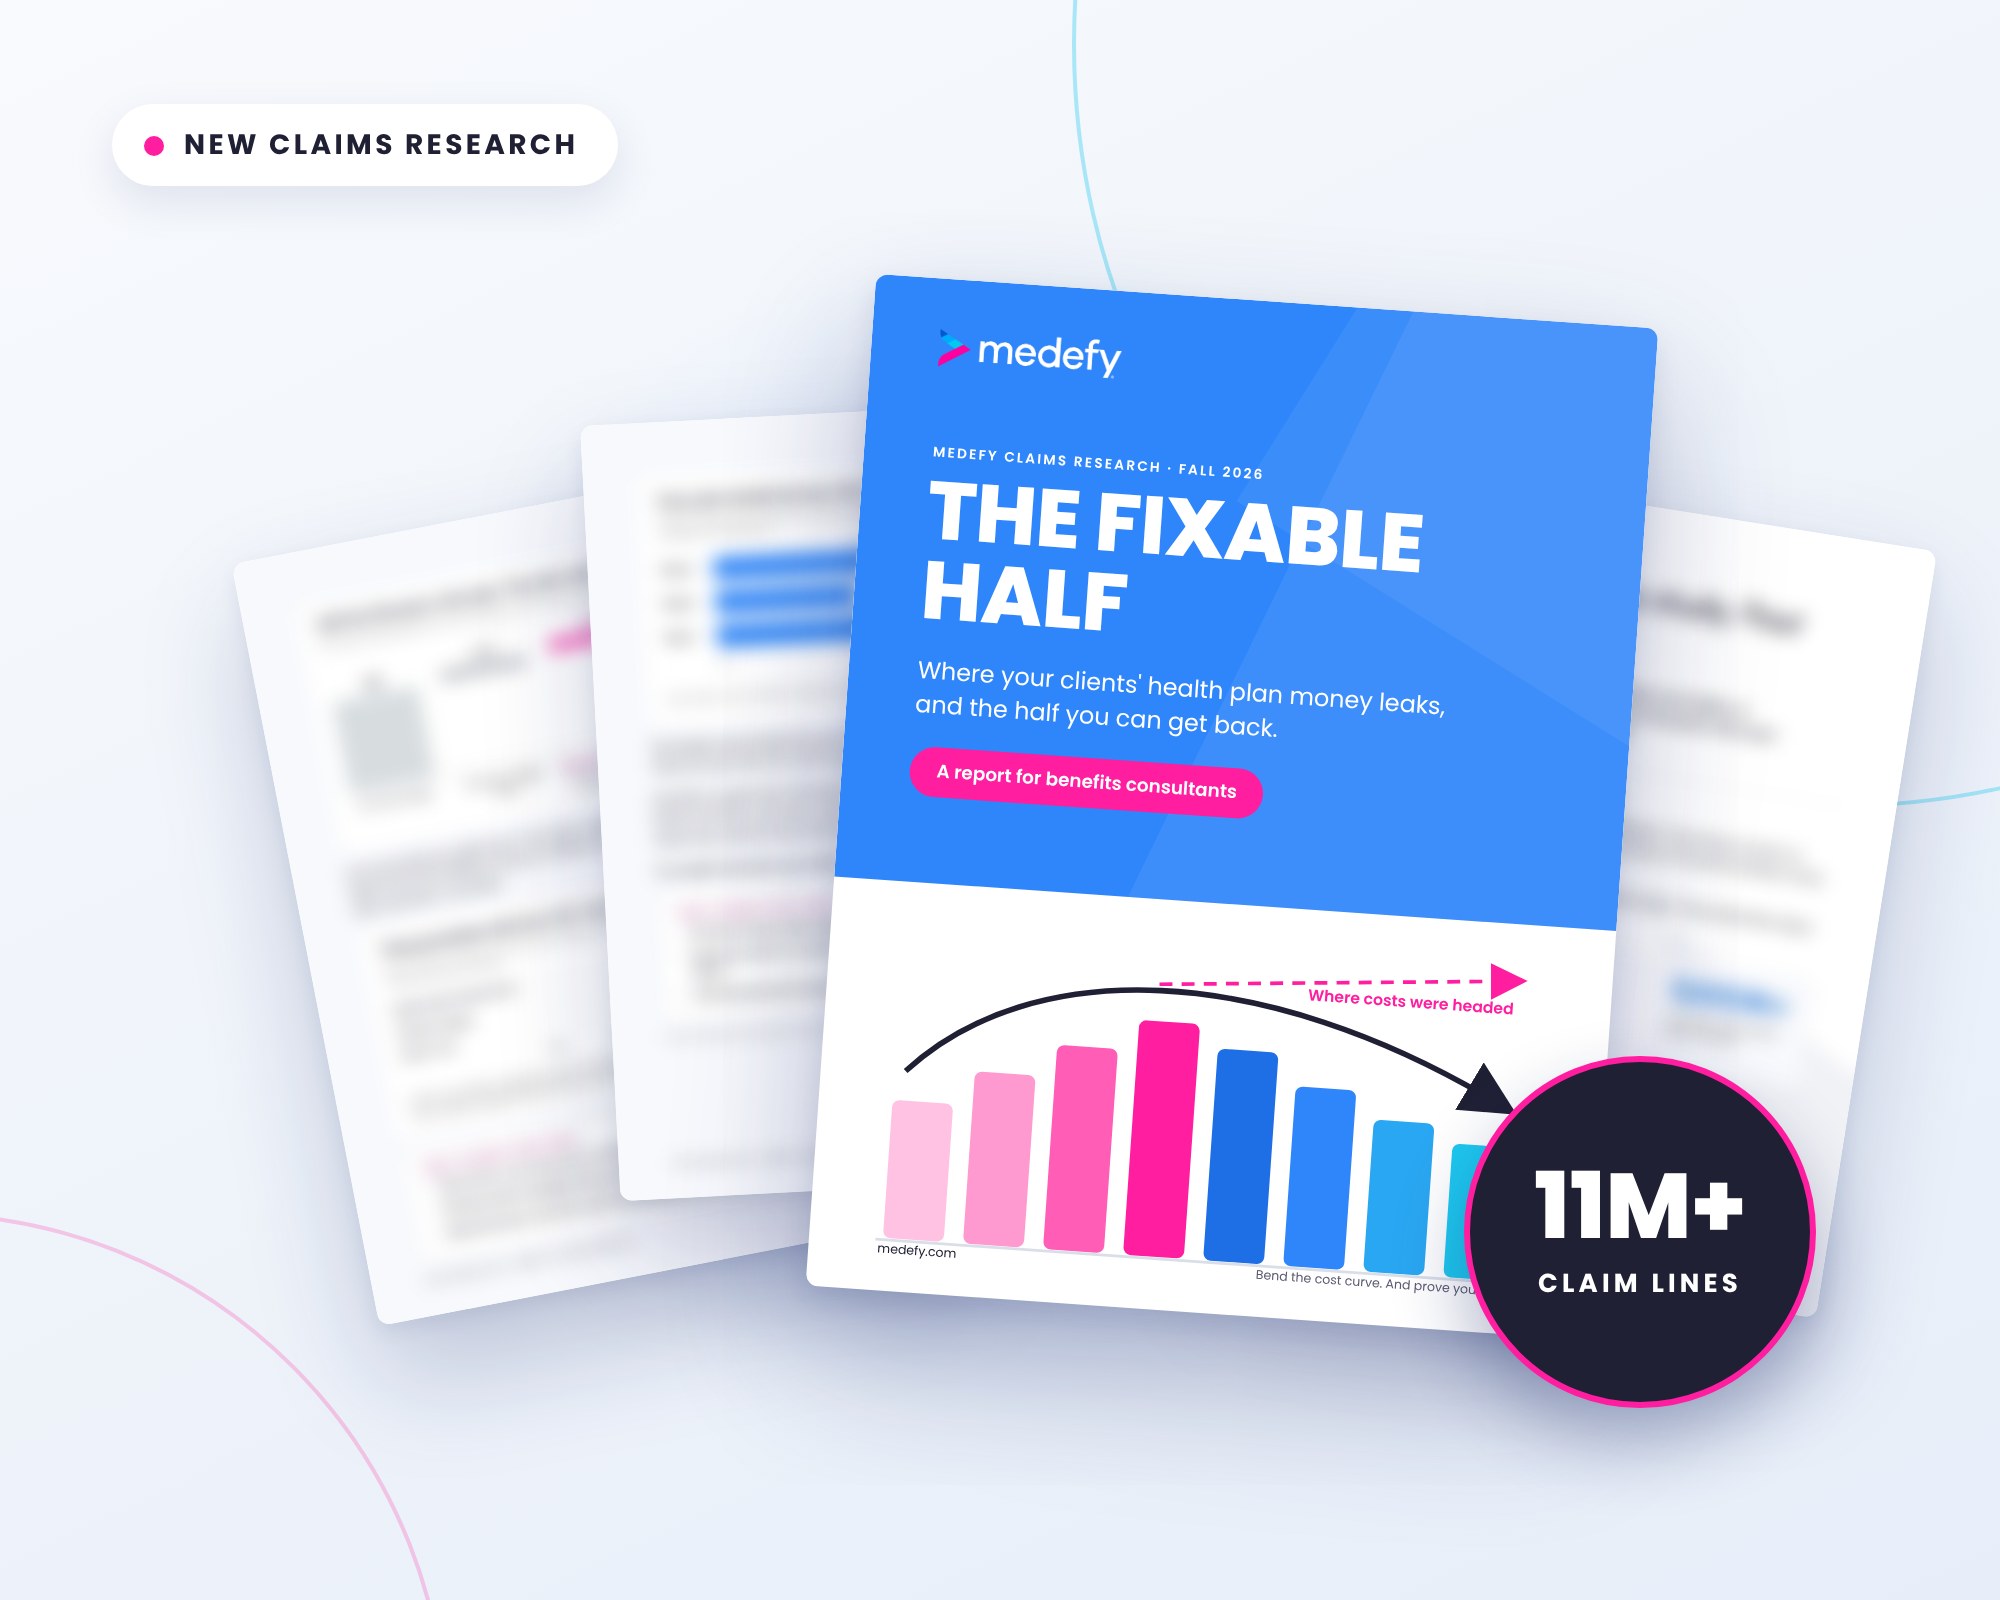
Medefy read the claims of four self-funded plans to find where the movable dollars sit. On every plan, about half of medical spend could still move. This report shows you where, so you can bring every client a plan they can act on.
The short answer
Medefy priced every care episode in 11M+ claim lines from four self-funded plans. On every plan, 40 to 55% of medical spend was fixable. Fixable means scheduled care where the member had a real choice of site, and a lower price sat in the same network.
11M+
claim lines read, every episode priced
4
self-funded plans, one Medefy client and three non-clients
40 to 55%
of medical spend fixable on every plan read
48%
average price gap for the same procedure in the same network
Five findings from the claims
01
On all four plans, plan-paid medical spend in Q4 ran about 20% above the first three quarters, two years in a row. About half of the jump is cost share, since the plan pays a larger share once deductibles are met. The rest is more care at pricier sites, and your clients can steer that part.
02
Every plan landed between 40 and 55%. Plan X, a Medefy client, read 50%. Plans A, B, and C have never worked with Medefy and read 45%, 40%, and 55%. The fixable share is what can move. It is not a savings figure.
03
Scheduled care drifts to the highest-priced settings. On the plans read, that held for 80% of imaging dollars, 60% of routine lab dollars, 60% of infusion dollars, and 55% of surgery dollars.
04
Across matched procedures on all four plans, the lower-cost site averaged 48% less than the standard site, inside the same network. Every category tested showed a gap, from 10% to 80%. None was zero.
05
2 of 3 plans already had a lower-cost option under contract. On one plan, several common procedures cost members nothing there. The plan was built right. Members were never given the tools to find the option at the moment they chose care.
Free PDF. No form to fill.
The price gap
The same scheduled service costs 40 to 70% less at a site a few miles away. These prices come from one plan's own paid claims. Both sites were in network. Members paid $0 out of pocket in every case shown.
| Procedure | Standard site | Lower-cost site | Lower by |
|---|---|---|---|
| CT of the abdomen and pelvis | $1,585 | $592 | 63% |
| Gallbladder removal | $12,537 | $4,732 | 62% |
| CT scan | $1,375 | $535 | 61% |
| Colonoscopy with biopsy | $3,338 | $1,416 | 58% |
| Knee replacement | $29,325 | $15,632 | 47% |
| Colonoscopy | $2,442 | $1,370 | 44% |
| Echocardiogram | $1,245 | $712 | 43% |
Savings depend on the member's plan and the care they need.
Definitions
Fixable spend is scheduled care with a real choice of site, priced against what the same plan already paid elsewhere in its network. Some care should never be steered, and the study leaves it out of the fixable share.
Method
Medefy read the paid medical claims of four self-funded employer plans, 11M+ claim lines in all. One plan has worked with Medefy for six years. Three have never been clients, and they range from about 1,000 to tens of thousands of members.
Claim lines were grouped into complete care episodes. For one plan, about 10M claim lines across 2023 and 2024 became 150,000 episodes. Each episode was priced against the same procedure at a high-value provider in the same network, using that plan's own paid claims. The study used no market benchmarks and no list prices.
Plans A, B, and C are anonymized. Their shares are rounded to the nearest 5% and their prices to the nearest $100. The analysis covers medical claims only.
Inside the report
Bring each client a plan they can act on, backed by claims like their own.
See which costs members can change, and the messages that help them do it.
Know which part of the trend can move before the renewal number lands.
Free PDF. No form to fill.
FAQ
The fixable half is the share of a self-funded plan's medical spend that can still move. Medefy found it was 40 to 55% on every plan it read. It covers scheduled care where the member has a real choice of site.
About half of medical spend, based on Medefy's read of 11M+ claim lines across four self-funded plans. The rest, such as emergencies and primary care, should not be steered.
Across all four plans, Q4 medical spend ran about 20% above the first three quarters, two years in a row. About half of the jump comes from the plan paying a larger share once deductibles are met. The rest comes from more care at pricier sites.
Prices vary by site, even inside one network. Across matched procedures, the lower-cost site averaged 48% less. On one plan, a CT scan cost $535 at one in-network site and $1,375 at another.
No. The fixable share is the part of spend that can move. Savings come when members choose the lower-cost site, and Medefy proves them in the plan's own claims.
Medefy grouped paid medical claims into complete care episodes. It priced each episode against the same procedure at a high-value provider in the same network, using each plan's own paid claims. It used no market benchmarks or list prices.
Free PDF. No form to fill.
Put it to work
B1H·2611·1.1